Welcome to Through the Gaps, the UK fishing industry's most comprehensive information and image resource. Newlyn is England's largest fish market and where over 50 species are regularly landed from handline, trawl, net, ring net and pot vessels including #MSC Certified #Hake, #Cornish Sardine, handlined bass, pollack and mackerel. Art work, graphics and digital fishing industry images available from stock or on commission.
Typical weather data pattern for an approaching depression heading in from the Atlantic - taken from the weather station aboard the now un-manned Sevenstones Lightship. The barometer falls (barometric pressure) as the centre of the low nears the south west - the wind speed increases in the other direction with similar rapidity.
The current sat chart shows the first depression to hit currently at 960 millibars - which is quite low........
twelve hours on and the chart for 0600 tomorrow morning has the low deepening to 943, which is very low - the closer the isobar lines around the centre of the low are together the stronger the wind - looks like the west coast of Scotland is due for a hammering again.
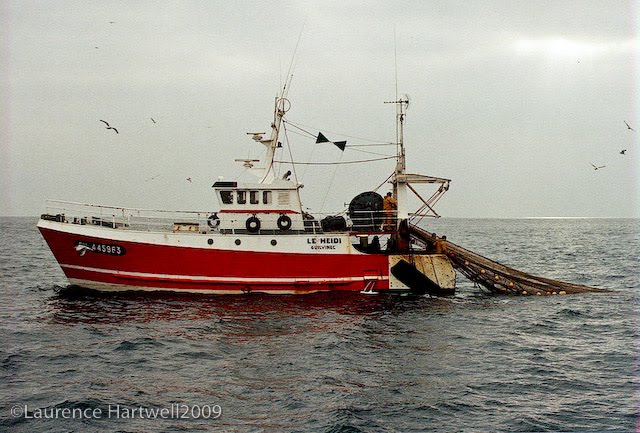
This chart is a print out from a weather fax machine aboard the Breton boat, Le Heidi when she was sheltering in Newlyn on the 11th January 1993 - it shows the 940 millibar depression moving at 25 knots across the Atlantic........
before deepening to one of the deepest lows ever recorded at a predicted 911 millibars it hovered around 915 - unless someone knows different?......
sou'west of Ireland a weather buoy's chart has the wave height dropping over the last 24 hours from a high point of 32 feet around midnight last night to around 20 feet this evening.........
and all hands tied up alongside - though unlike not too many years ago, there's not a single French boat in sight!
At sea, an old saying has it that; wind before rain, set your sails again, rain before wind, sheet your sails in - in other words, if the heavy rain comes first and is followed by a rising wind (generally in this area from the south west) - look out!


