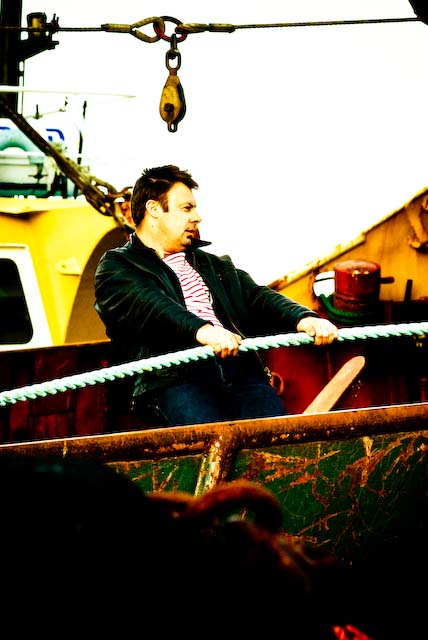
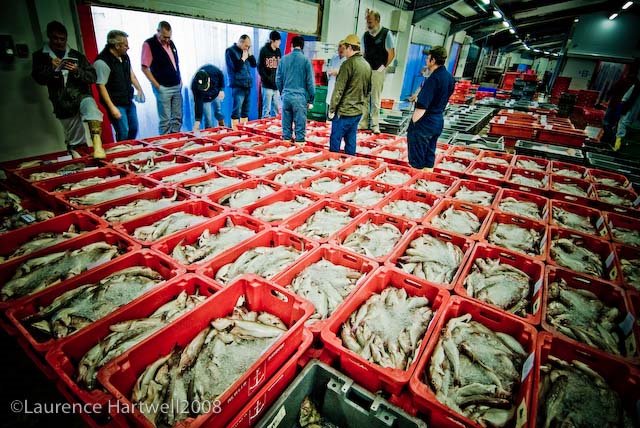
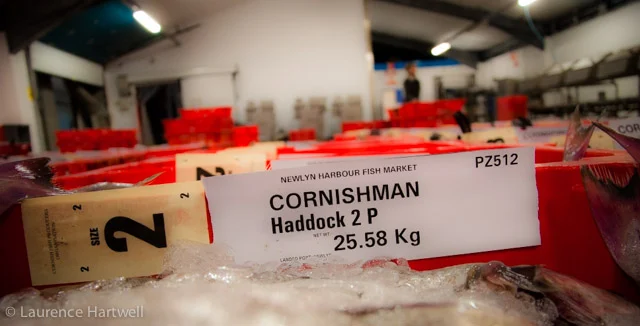
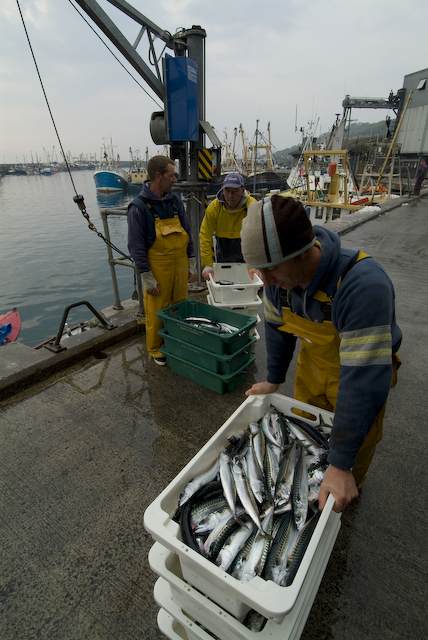
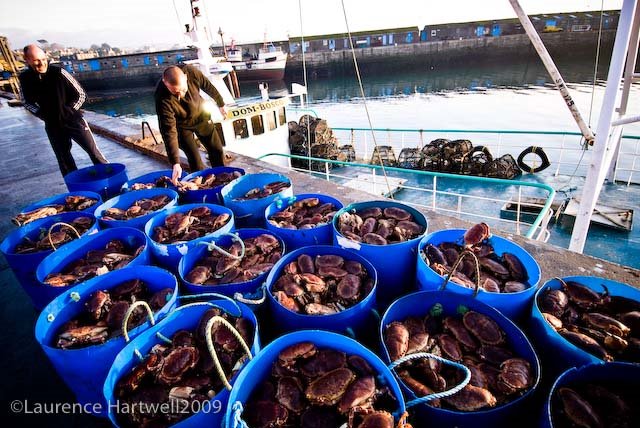
As Brixham features on the cover of the report proper it's only fair Newlyn gets as look-in here, as the second largest port by value in England.
Fleet size and employment In 2014, the UK fishing industry had 6,383 fishing vessels compared with 7,022 in 2004, a reduction of 9 per cent. The fleet in 2014 comprised 5,026 10 metre and under vessels and 1,357 over 10 metre vessels.
How many fishermen? There were an estimated 11,845 fishermen in 2014, down 12 per cent since 2004. Of these, 5,367 were based in England, 850 in Wales, 4,796 in Scotland and 832 in Northern Ireland. Part-time fishermen accounted for 18 per cent of the total, the same proportion as a decade ago.
Landings by weight: In 2014, UK vessels landed 756 thousand tonnes of sea fish (including shellfish) into the UK and abroad with a value of £861 million. This represents a 21 and a 16 per cent increase in quantity and value respectively, compared with 2013. Average prices for demersal and shellfish have increased whereas pelagic prices have decreased.
In terms of quantity, more than two thirds of the Scottish and Northern Irish fleets’ landings were pelagic fish. The Welsh fleet landed mainly shellfish. Demersal fish formed the largest component of landings by the English fleet in 2014
Falling catches of cod and haddock have contributed to the large reduction in demersal landings since 1996. In 2014, the UK fleet landed 29 thousand tonnes of cod (down 64 per cent since 1996) and 36 thousand tonnes of haddock (down 60 per cent since 1996). This represents a combined decrease of 105 thousand tonnes.
In 2014, 288 thousand tonnes of mackerel were landed, almost three times higher than the low point of 2006. Since 2011 herring landings have risen by 59 per cent to 98 thousand tonnes, their highest amount in eight years.
In 2014, 30 thousand tonnes of nephrops were landed, a 32 per cent decrease since the high point of 2007. Landings of crabs have increased by 57 per cent since 1996 to 36 thousand tonnes. The quantity of scallops was 39 thousand tonnes, more than twice the amount landed in 1996, but 32 per cent less than the peak of 2012.
The UK fishing fleet:
The number of registered UK fishing vessels has fallen by 26 per cent since 1996. Capacity (GT) and power (kW) have decreased by 29 per cent and 25 per cent respectively over the same period (see Table 2.1). As well as an underlying downwards trend in the size of the fleet associated with reduced fishing opportunities, UK fisheries administrations have operated decommissioning exercises in 2001-2002, 2003, 2007 and 2008-2009. The decommissioning exercises aimed to withdraw some capacity and effort from UK fisheries to help ensure a sustainable future, and to allow vessel owners to take a business decision on whether to remain in the fishery under the terms of fishery management plans.
Statistical oddities:
The overlapping areas of interest of the fleets make it difficult to provide a simple explanation of the differences in fleet structure across the UK. One relevant factor is the different fishing opportunities the fleets are engaged in. Key elements of the Scottish fleet are engaged in several fisheries that are high volume but lower priced. This includes fisheries such as the herring and mackerel fisheries in the North Sea and West of Scotland waters. As such the Scottish fleet has moved towards having higher capacity vessels, which, for economical viability, cover large sea areas and can catch several hundred tonnes of fish per trip. Compared with this, the English fleet is involved in several key fisheries that are typically lower volume but higher priced, such as the Channel fisheries for sole and plaice. In addition, a greater proportion of the fisheries the English fleet is engaged in cover inshore areas. Together these factors have allowed the English fleet to develop with a greater proportion of smaller vessels that are able to be economically viable through catching smaller quantities of more valuable fish. Changes over time in the nature of fishing opportunities available to the different elements of the UK fleet have also been key drivers for the development of the fleet.
In 2014:
Newlyn had the largest number (614) of vessels in its administration. 87 per cent of these were of 10 metres and under in length.
The fleet administered by Fraserburgh had by far the largest capacity (32,291 GT) and power (87,704 kW).
The largest proportion of 10 metre and under vessels was in Hastings (94 per cent).
Aberdeen and administration ports in Wales, the Channel Islands and the south and west coast of England also had large proportions of 10 metre and under vessels.
Data collection for vessels over 10 metres in overall length.
Data collected on fishing effort by over 10 metre vessels come primarily from the fishing logbook. Two additional sources are used to collect data on landings by over 10 metre vessels: landing declarations and sales notes. The fishing logbook captures data on fishing activity by individual vessels by trip, and for each day of activity within a trip. This includes details of the catch, by species, in terms of the presentation and quantity of fish retained on board. Information is also collected on the fishing gear used and the ICES division, rectangle and zone for the activity. Supply of logbook data is mandated by legislation for all vessels over 10 metres overall length in respect of catches of all species. Logbook data for UK vessels must be submitted within 48 hours of landing to UK authorities; this includes landings into foreign ports. Landing declarations provide information on the weight and presentation of fish landed by species. As with logbooks, landing declarations must be submitted to authorities within 48 hours of completion of the landing. Sales notes are required in respect of first sales of fish and fishery products. For paper declarations, sales notes for first sales of fish must be submitted to UK Fisheries Administrations within 48 hours of sale by the registered buyer of the fish, except at designated auction centres where the registered seller has responsibility. This reduces to 24 hours if they are required to report sales notes electronically (see information below in the section “Requirements to report fishing activity data electronically").
Requirements set out in EU legislation to require the submission of logbook and landing declaration data electronically have in recent years been phased so that now virtually all UK vessels 12 metres and over in overall length are required to report their activity data by electronic means only. This phasing out of paper reporting was introduced on a vessel by vessel basis as onboard systems were installed, checked and tested through a period of double-running before vessels switched over to electronic-only reporting. Additionally, from 1 January 2009, buyers and sellers with an annual turnover of first sale fish of more than 400,000 euro have been required to submit sales notes electronically; this threshold was reduced to 200,000 euro from 1 January 2011. A UK Electronic Reporting Systems (ERS) Hub has been set-up to collect, process, and store these electronic data.
For more information please see the Marine Management Organisation website at: https://www.gov.uk/record-and-report-your-fishing-activity-and-submit-sales-notes.
Data collection for vessels 10 metres and under in overall length
For 10 metre and under vessels, there is no statutory requirement under either EU or national legislation for fishermen to declare their catches. Historically, information for this sector has been collected with the co-operation of the industry: it comprised log sheets and landing declarations voluntarily supplied by fishermen as well as sales notes and assessments of landings collected from market sources and by correspondents located in the ports. This collection of data has now been replaced after the introduction in September 2005 of a scheme of registration for buyers and sellers of first sale fish (see above). Sales notes are now used in addition to the voluntary information from fishermen.
During 2005 and 2006, UK Fisheries Administrations introduced a system of restrictive licensing for activity targeted at shellfish. As part of this system, new reporting requirements were introduced involving a requirement for fishermen fishing with under 10 metre vessels to complete diaries of their daily activity which needed to be submitted on a monthly basis. Summary information from these diaries is in use in Northern Ireland and it is used alongside other data in other parts of the UK, but the main source of activity data in the rest of the UK is the sales notes data. This helps to ensure consistency with the activity data for other types of fishing activity that are also derived from the sales notes data. The diaries of activity are however an important source of information for the 143 scientific assessment of the state of the local shellfish fisheries around the coast and as such the data in them are entered, collated and analysed by scientists at the fisheries laboratories around the UK. Coverage Data collection for vessels over 10 metres overall length aims to achieve full coverage of activity by this sector of the fleet. For the sector 10 metres or under in overall length, landings are only reported where the fish are sold or data have been provided voluntarily, leading to reduced coverage1 .
The reliability of the data collected is dependent on the information provided by fishermen. Inspectors at port offices carry out a mix of manual and automatic checks on the information provided by vessel operators. These include a check between logbook information and that given in the sales notes or observed as landed as well as checks against other sources of information (e.g. satellite position reports, information from aerial and at-sea surveillance and inspection activity carried out by UK enforcement officers). Despite legal obligations for fishermen to declare their catches, a proportion of fishing activity remains unreported. This chiefly affects landings data and the effects on statistics on fishing effort are considered to be small.
A 2009 study2 jointly funded by the Department for Environment, Food and Rural Affairs and the Department for International Development estimated that between 2000 and 2003, illegal fishing in the northeast Atlantic amounted to between 5 and 13 per cent of reported catches of species studied. The extent of illegal and unreported fishing by UK vessels is uncertain and varies across stocks. However, it is considered that the overall level of unreported fishing has been reduced in recent years following the introduction of a scheme of registration for buyers and sellers of first sale fish, and the implementation of Commission Regulation (EC) No. 1005/2008 establishing a Community system to prevent, deter and eliminate illegal, unreported and unregulated fishing.
It should be noted that landings do not typically equate to total catches, as fish may be returned to the sea through a practice known as discarding. The degree of discarding varies by stock, and by the sector of the fleet involved. The figures presented in this publication should not be interpreted as total removals from the sea.
Data processing Information from log sheets, landing declarations, sales notes and other sources is keyed into computers connected to the main databases by government staff at port offices, or is transferred electronically from the UK ERS Hub. Details of the areas fished are taken from the logbooks and entered as codes for the ICES divisions and statistical rectangles. Where a statistical rectangle is split into different areas (e.g. part is in EU waters and part in Norwegian waters) an additional code is used to indicate the zone fished. Where a vessel fishes in more than one area in a single trip, the total amounts for the trip of each species, as given in the sales notes and landing declarations are allocated to the areas in proportion to the estimated quantities of the species taken from each area, as recorded in the logbook.
Here is an online version of the full report:


